How-to view KPIs on M2Web

The KPI feature of the Ewon Flexy enables users to easily get instant information about the health, performance or targeted key values of all their connected machines.

The process can be described in 3 steps:

Set a Ewon Flexy tag as KPI

Inside the Ewon Flexy interface,
Go in Tags > Values configuration page, where you can configure up to 6 tags as KPIs.
This supposes you already have a PLC linked to your Ewon and from which you can retrieve data.
More details on the Ewon Support web site in the Data Acquisition section.

Once set as KPIs, they are automatically displayed on the summary page.
This page can be directly browsed locally on you Ewon Flexy.

   Discover how-to create Tags, Alarms and more on the Ewon Flexy with the help of this e-Learning course    

Publish the Ewon Flexy KPIs to Talk2M

You need to configure the Ewon Flexy to send the KPIs to Talk2M to make them appear in M2Web.

Inside the Ewon Flexy interface,
Go to the Data Management web page of your Ewon (Setup > System > Main > Data Management)

In the Talk2M API menu, activate the "Live data and KPI’s" option and click update.

Visualize the KPIs on M2Web

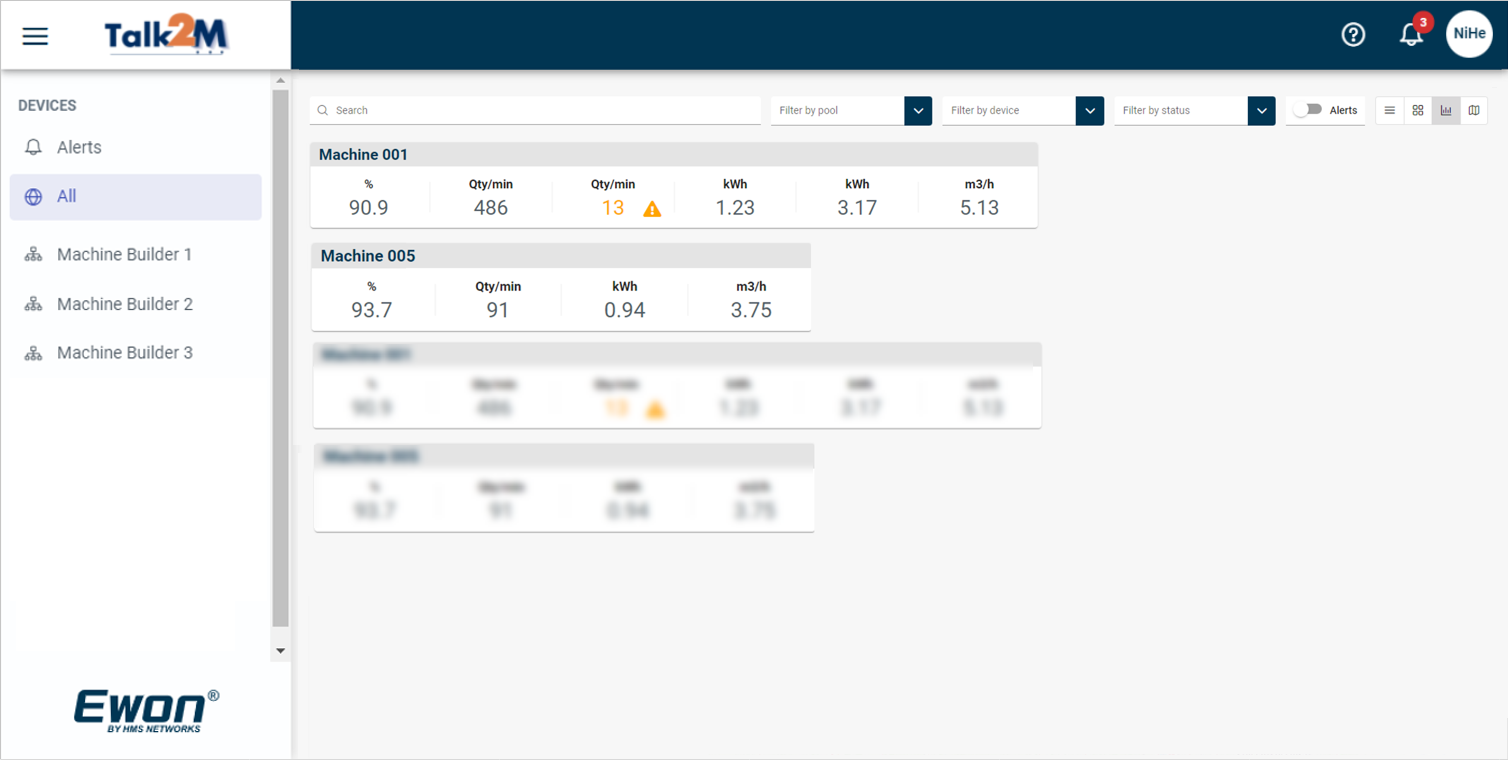
Visit the M2Web platform and log in to your account to visualize the KPIs. 

In M2Web, the information is presented in a modern responsive graphical interface.
Each KPI visually displays the alarm status: Blue for normal state, Yellow for warning, and Red for alarm.  

This information is also reflected on the M2Web Map view